1. Excel: How to Keep Leading Zeros

    As a guy who uses Excel to open CSV (comma-separated values) files pretty often, I’d like to offer a pro tip:

    Excel will always drop leading zeros in a column of data unless you *import* the CSV file!

    In my Day Job, I often have to work with CSV files which contain job codes which sometimes start with zero — like “08124500” and similar. If I just double-click that file and open it in Excel, well, those leading zeros will always go bye-bye.

    If that’s not what I need (and usually it isn’t), then the only way around it is to open Excel on its own, and then import the CSV file the, uh, slow way.

    (I’m using Excel 2016 currently, but instructions here will be similar for most versions from 2010 and later.)

    1. Open Excel; i.e., a new blank Excel file.
    2. In the Office ribbon, choose the DATA tab.
    3. Look for a section of the ribbon named “Get External Data.” Click the “From Text” button.
    4. Button - From Text

    5. A file selection window titled “Import Text File” appears. Navigate that to your CSV file. Click IMPORT.
    6. Excel will walk you through the multi-step file import. The important thing here is Step 3. Click the column with the leading zeros, and set its Data Format as TEXT, rather than GENERAL.
    7. When Excel imports your CSV data, the leading zeros will still be in place!

    So remember: When bringing CSV data into Excel, you have to account for the fact that Excel will always try to figure out what type of data you have — and to Excel, “08253641” sure looks like a number. Which means the leading zero will be dropped. And if Excel guesses wrong, you might have big problems!


  2. Excel or Access?

    It was a hard truth to learn, and it took years for me to learn it, but facts is facts:

    There are times when Excel just isn’t the right tool for the job.

    Now, Excel and I get along swimmingly. I’ve devoted hundreds of hours to learning its “ins and outs,” and I regret none of that. To this day, I still get a little giddy when I discover a new function that’ll be useful to me somehow.

    But darn it, Excel just isn’t the right tool for managing data … especially if it’s relational data. (“Relational data” meaning that data in this table over here has a specific relationship to data in that table over there … and maybe even more tables of other data beyond that.)

    Excel Was My Best Friend.
    Access Was a Weird Guy Across the Street. (Nobody Talks to That Guy.)

    I can’t remember when I was first introduced to Excel — probably the mid- to late-1990s — but I was a fan from Moment One. I also can’t remember when I was first introduced to Access (the database program Microsoft bundles with its Office suite), but it was probably ten years later, if not more. It took me a long while to figure out why anyone would bother with Access. Excel was SO much easier to learn and implement for whatever tasks I had at hand. In fact, at my Day Job, while Excel licenses were utilized by just about every employee in the place, it wasn’t until a few years ago that Access licenses were made available — and even then it was by request only.

    So without knowing it, early in my career, I was trying to shoehorn Excel into doing data-management jobs for which it wasn’t really built. One particular spreadsheet I created, maintained, and added data to over 15+ years, across multiple worksheets … only to find out last year why it should’ve been exported to an Access (or similar) database long, long ago.

    (When you need to search for, say, multiple part numbers across about 20 separate worksheets, you figure out pretty fast just why a good relational database is as valuable as it is. And why Excel isn’t good for that AT ALL.)

    So now I have this Excel spreadsheet with 15 years of work-related data crammed into it. It’s not unusable by any stretch, but depending on the searching that needs to be done, it can be, uh, ungainly. At best.

    For THAT data-management job, I should’ve used Access. I’d be much better off now.

    Excel vs. Access: Which Tool for the Job?

    So, having lived and learned, here are MY thought processes for deciding whether to use Excel or Access for any given job:

    • If it’s a numbers task, and you want pretty charts and complex calculations run on the data, then Excel.
    • If it’s a flat-file, one-table sort of database, then either Excel or Access might do the trick.
    • If it’s a multi-table database with no relationships between tables, then Access is probably a better choice. But Excel could be workable. (Especially if complex searching is not required.)
    • If it’s a data-driven task, which will rely on text, numbers, text and numbers, or other file types being accumulated, modified, and analyzed over time, then Access.
    • If you need to implement strict controls on non-numeric data which users enter and/or modify, then Access.
    • If your data needs to have relationships (e.g., this table shows part numbers, and that table shows work operations, and the two tables are somehow “related” in use and/or search-ability), then Access.
    • If the end result of your data requires complex queries, searches, and filters, then Access.

    Note that these aren’t hard/fast rules. They’re just how I approach the problem now. You see, I’m all the time watching folks try to make Excel handle jobs which would be much better suited for a database program of some sort. But suggesting such a thing (“What? But I already know Excel!”) is almost always dismissed out-of-hand. At some point, I’m afraid, they’ll be sorry.

    Hey — just because you CAN whack a nail into a two-by-four with a heavy Swingline stapler doesn’t mean that’s the way you OUGHT to do it.

    ASIDE: Hey, people look at me like I’m nuts when I tell them that Quicken is 80 percent database, 5 percent math and calculations, and 15 percent bloat and unnecessary features. But it’s troof. Quicken’s database back-end is the workhorse!

    Here, by the way, are Microsoft’s thoughts on the issue:

    Office.com: Using Access or Excel to Manage Your Data

    Much wordier than mine, but very thorough, and worth a read-through.


  3. Excel: Create Drop-Down Menus

    Thanks to my popular Excel page, I’ve gotten several questions recently about how to create drop-down menus in Excel. Yes, a quick Google search for “Excel drop-down list” or similar would likely educate most folks well enough, but I’ve haven’t posted in a long while … and this seems like a fine little tutorial to add to my collection.

    NOTE: I’m using Excel 2010 for this tutorial. Instructions would be pretty much the same for Excel 2007 and later versions.

    Excel Feature: Data Validation

    The feature in Excel that allows for us to use drop-down menus in cells is called Data Validation.

    Data Validation

    In truth, Data Validation allows a spreadsheet creator to control all kinds of things about what the user might enter in cell or group of cells. But when it comes to creating a drop-down list for users to choose from, well, that’s where lots of questions tend to arise.

    So let’s pretend that we have a spreadsheet in which we want our users to enter, in Cell B6, one of four choices:

    • Visa
    • MasterCard
    • American Expresss
    • Discover

    First, we need to put those options somewhere in our spreadsheet for Excel to find. So I’m going to enter our “list” of options in Cells A1 through A4:

    Data Validation - Create a List

    Note that I don’t have to create my list of options in the same worksheet; it could be in a different worksheet, too, and in any group of consecutive cells you like. The list can also be in hidden rows; that’s what I end up doing most often in my own spreadsheets.

    Now that we have our list, and with Cell B6 as our active cell, we’ll do the not-so-hard part:

    1. In the Excel ribbon, select the DATA tab.
    2. Click the DATA VALIDATION button.
    3. In the SETTINGS tab, find the “Allow:” box, and select “List.”
    4. Now, below that, in the “Source” field, we’ll tell Excel where to find the list of choices we want users to have. In this case, our list is in the area defined by $A$1:$A$4. (The dollar signs tell Excel that these are absolute references to those rows and columns.)

    5. In the “Source:” field, type “=$A$1:$A$4” and then click OK.

    And just like magic, you’ll see the drop-down menu indicator next to Cell B6. Click that, and our four choices appear in a drop-down menu:

    Data Validation - Drop-Down Menu

    And that, folks, is all it takes to create a drop-down list in any cell (or cells) of your Excel spreadsheets!


  4. 8 Tips for Building a Better Spreadsheet

    Being a financial dork of the highest order, it should go without saying that I love spreadsheets. And I particularly enjoy the process of building good, useful ones.

    Having been a spreadsheet aficionado for many years now, I thought it might be fun to scribble down a few of the “rules of thumb” for spreadsheet creation which I’ve learned over this time.

    (Not only do I make free and for-pay financial spreadsheets for web surfers at large, but my Day Job involves lots of spreadsheet use, too. And many of these spreadsheets get distributed throughout the company, for use by everyone from fresh-faced newbies to blurry-eyed Excel veterans.)

    That said, here are a few of my personal “Rules for Creating Spreadsheets That Don’t Suck.”

    Tip #1: Spreadsheets For You ≠ Spreadsheets You Distribute

    You might be able to get away with leaving cells unlocked (and the worksheet unprotected) in a spreadsheet you make for your own use, since you as Spreadsheet Creator presumably know what goes where. But that won’t fly with spreadsheets that you distribute for use by others.

    There’s just no telling what someone else will type, nor where they’ll type it. Let’s face it: Stray key-punches are a fact of life. Get a homeless [SPACEBAR] entered into a vital, formula-holding cell, and an entire spreadsheet can detonate.

    And that ain’t good.

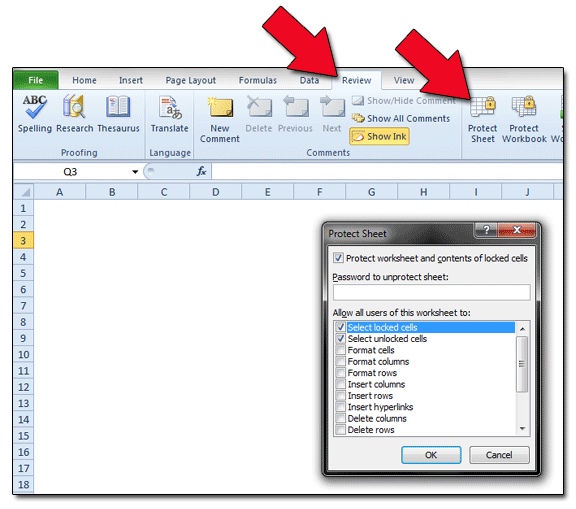
    So be sure to unlock ONLY those cells where users are expected to enter data…

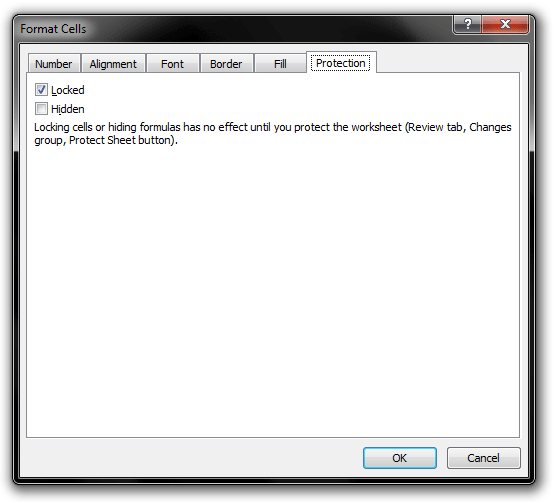
    … and then PROTECT that worksheet!

    Tip #2: Appearance freakin’ matters.

    We’ve all seen them: Spreadsheets emailed to us by coworkers with NO idea of how to arrange and design data in a way that makes sense. Cell text overruns gridlines like snakes dumped on a chessboard; instructions are vague at best; you couldn’t make the page suitable for printing if you taped three sheets of legal paper end to end. What goes where? What’s that army of “#####” symbols in Column G supposed to signify? Should I enter new data in Cell R3, or not? Good luck figuring all this out without going thru every cell by hand … and taking notes.

    Yeah. So, without any sort of cell formatting (read: background colors, borders, and so on) and coherent design to guide us, the actual usability of Coworker’s Latest Creation plummets so fast that it takes an act of God to keep this Excel disaster from being clicked ‘n’ dragged to a Recycle Bin demise.

    In other words, appearance matters. A little cell formatting — often as simple as some understated background colors in those cells where data should be user-entered, with white for everything else — goes a long, long way. The latest versions of Excel provide a metric crap-load of tools to make your spreadsheets look decent. CELL → FORMAT is nothing to be afraid of, you know.

    In other words, the best spreadsheets are a joy to look at, and work with. And the BEST best ones don’t look like spreadsheets at all.

    Tip #3: Gridlines Are Bad. White space is good.

    Plus, it’s easy on your printer. So use it liberally.

    (This includes getting rid of gridlines, and instead manually creating cell borders when necessary. Unused oceans of gridlines are the devil.)

    Tip #4: Color is most effective when used sparingly.

    Remember what I said about using color above? Well, don’t go overboard with that. Personally, I like to color (and unlock!) only those cells where users will need to enter data. All other cells are left white. (And locked!)

    Tip #5: Provide Detailed Labels and Notes…

    Thinking a field is “self-explanatory” courts disaster. You pretty much have to get inside the user’s mind and consider this stuff; you ponder what they’ll be thinking and seeing and deciding. Any guidance you can give that helps get the user’s Datapoint A into the correct cell will pay off big.

    Tip #6: …But Remember That Most People Don’t Read.

    Nobody reads a darn thing anymore. I’m fairly confident that 99% of users start hammering numbers into most spreadsheets without throwing so much as a glance as the “Instructions & Notes” worksheets I almost always provide. But that’s the world we live in.

    Build with the 99% in mind, but put some time into decent worksheet notes, too. Appreciate the 1%.

    Tip #7: Gonna distribute? Use version numbers!

    This is most applicable if you’re building spreadsheets for business use, where more than one person will be using the program. But it can also be helpful if you’re distributing your Excel creations on the internet.

    By applying version numbers to your spreadsheets, you make it easier for users to know which iteration they’re working with. It also makes it a snap to determine if the spreadsheet version that Ron, your nosey coworker in Cubicle B3, is working on is newer and better than yours.

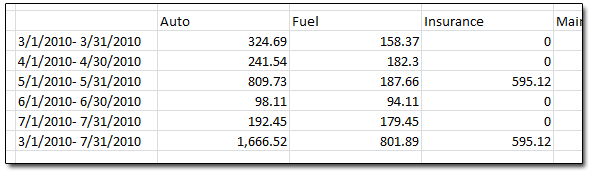
    Tip #8: When possible, place column SUM formulas at the top of the data they tabulate.

    This is kind of a little thing, but man, has it made my spreadsheeting life easier.

    One of the great features of spreadsheets is their ability to analyze ever-changing amounts of data. However, when you build a spreadsheet to account for, say, a column with 100 rows of data which need to be totaled up, you might as well plan on that spreadsheet someday needing to total up 200 rows instead. So to make such a change easier, put your SUM formulas ABOVE the column’s uppermost data cell.

    I know that for myself, it’s almost instinctive to want to total up columns (when that’s what is required) at the bottom of the current data. (Thanks, every math teacher I ever had!)

    Here’s an example:

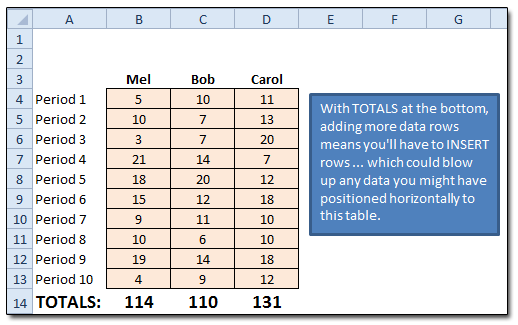
    However, placing the TOTALS (or whatever formula you need) at the top of each column’s data makes it much easier to expand your data “downward” later:

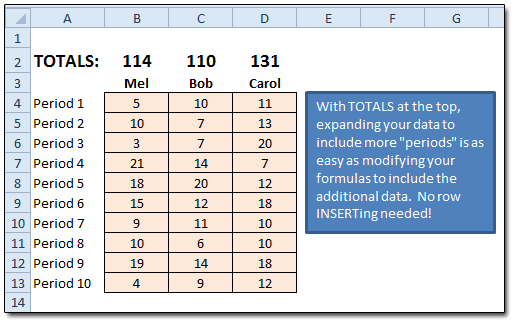
    With formulas at the column tops, you won’t have to go to the trouble of inserting rows (and possibly hosing your formulas) later on, when the need for more data becomes official … as it seemingly always does.


  5. Excel: Keyboard Shortcut to End of Column

    A purchaser of my Check Register spreadsheet recently emailed me, asking if there was a quick way to get to the bottom of her register — to get to the first blank row, in other words, in order to quickly add a new transaction. When you have five hundred transactions in your register, scrolling all the way to the bottom of your data so you can enter a new transaction … well, it just ain’t a lot of fun.

    Now, Excel has always had lots of keyboard shortcuts. The one that’s most applicable here would be the [CNTRL]-[DOWN ARROW], or [CNTRL]-↓, shortcut.

    Getting to the Bottom of It

    When I press the [CNTRL]-↓ combination, Excel will automatically take me down to the last nonblank cell in my current, active column. So, in the case of my Check Register spreadsheet, placing Excel’s cursor in any cell in the DATE column (Column C), and then pressing [CNTRL]-↓, will take me to the last nonblank cell in that column.

    From there, a single arrow-down keypress gets us to the next blank row, and we’re ready to enter the new transaction. No scrolling involved!

    (Conversely, pressing [CNTRL]-↑ would take you to the topmost nonblank cell in your current column.)


  6. Excel: Switching Rows & Columns

    Every so often I find the need to swap (or transpose) rows and columns in Excel.

    Take a report generated in Quicken, for instance. I like to see how my spending categories change from month to month. Getting Quicken to generate a Spending Report that shows this is really easy. In the Quicken menubar, REPORTS → SPENDING → SPENDING BY CATEGORY will get you there. Generate the report, then select your Date Range. Add a column for “Month” and you’re set:

    Spending-By-Category Report

    Exporting this data to Excel is a simple matter, too. In the Quicken report menubar, choose EXPORT DATA → REPORT TO EXCEL-COMPATIBLE FORMAT, then give your data a save location and a name, and save it.

    One problem, though: When opened in Excel, Quicken reports usually have the date periods as columns, and spending categories reside in rows. What if you want your categories in columns, and your dates in rows? (This is usually my preference.)

    Thankfully, Excel makes such a switch very easy to do.

    Transposing Rows & Columns in Excel

    As an example, I created a “Spending by Category” report in Quicken which shows my auto expenses for a portion of 2010 (March 1 thru July 31):

    Spending-By-Category Report

    Exporting that to an Excel-compatible format gives me a text file, which I named “Data2.txt” and saved on my desktop. I then opened a blank Excel spreadsheet, and from within Excel, I then opened Data2.txt.

    Importing a text file to Excel like this is quite easy: In the Excel menubar, select FILE → OPEN. Navigate to the text file you wish Excel to import. Excel opens its Import Wizard, where you can change column breaks and ignore rows as necessary. When you’ve finished this, click OK to close the Import Wizard, and your text file should now be converted into Excel.

    Readers who wish to follow along with the files I’m using can get them here:

    Excel File: Sample Data (ZIP file with Data2.txt and Data2.xls inside)

    Just download and extract that ZIP file, and you’ll have the files I use below. Play with them as you wish!

    Once the text file has been opened in Excel (I’m using Excel 2010), it’s time to work some magic. We want our date headers to be in rows, rather than columns, and our categories to be in columns, rather than rows.

    First, select the area of data to be transposed. In this case, that’s B5 thru H13:

    Select the data to transpose.

    Now right-click inside that area, and select COPY:

    Right-click and select COPY

    Now place your cursor in the spot where you want the data to be moved (and transposed) into. For this example, I’ll select Cell B15. In that cell, right-click again, and choose PASTE SPECIAL:

    In the PASTE SPECIAL menu that appears, select TRANSPOSE:

    PASTE SPECIAL -- TRANSPOSE

    Our data rows and columns have now been switched (transposed)!

    Data is now transposed.

    I can’t tell you how many times that this feature of Excel — being able to swap rows and columns with a few clicks — has saved me TONS of work!


  7. Quicken’s Register Calculator

    As readers probably know, I’m a big fan of Quicken. It’s my finance-tracking tool of choice, and has been since the mid-1990s.

    Last week, I received an email from reader Dennis, who apparently has caught on to something of a shortfall in Quicken’s internal register calculator. For those of you who aren’t sure what that is, here’s a screenshot:

    Quicken's internal register calculator

    If you have numbers to add or subtract, you can do it inside the SPEND and RECEIVE columns in Quicken’s register. Anyhow, here’s what Dennis had to say:

    In your review of Quicken 2010 you revealed that you have been a Quicken user for a number of years. Personally, I’ve been using it since the second release.

    I’d like to alert you to a bug in Quicken that has been for many years. I submit a bug report on this issue with every new release, but apparently one user isn’t enough to promote change. Maybe you would have better luck.

    The Quicken Register Calculator does not perform calculations in the mathematically standard priority sequence of Parenthetical, Exponential, Multiplication, Division, Addition and Subtraction operations. Using the Register Calculator, the key strokes “2+3*3+5*3” are evaluated as “(((2 + 3) * 3) + 5) * 3” resulting in 60 (the wrong answer) instead of “2 + (3 * 3) + (3 * 5)” which results in the right answer of 26. Anyone accustomed to using any standard calculator will experience this error.

    To avoid this error, it’s necessary to add repetitive values individually when using the Register Calculator (2+3+3+3+5+5+5 = 26). It’s a lot easier (and more accurate) to use any external calculator and copy the result into Quicken; however, since that last step creates an opportunity for transcription error, so it would be better if Intuit would simply fix the Register Calculator. Of course they could rename it to “Register Adding Machine” which would at least alert the user that it doesn’t function as a ‘Calculator’.

    Dennis’ note caused me to think: I can’t remember the last time I used any Quicken calculator. I almost always have Excel open, so it’s kind of become my default “quickie” calculator. And now that the calculator in Windows 7 shows you all the numbers you’ve entered …

    Windows 7 Calculator

    … as you input your formula, I have even less reason to utilize any “calc-ability” inside Quicken.

    I spent some time trying to think of a situation where having Quicken calculate this way — computing what is effectively a formula, and doing it without standard mathematical priorities — would be an issue for me, but I couldn’t come up with one. Again, I’ve grown accustomed to using Excel as my calculator for pretty much everything.

    I suspect that Intuit programmers never really intended this feature to do much more than add or subtract a string of numbers. Don’t guess I can really fault them for that, either. It’s awfully tough to program software that can do everything for everybody!