1. Excel: How to Keep Leading Zeros

    As a guy who uses Excel to open CSV (comma-separated values) files pretty often, I’d like to offer a pro tip:

    Excel will always drop leading zeros in a column of data unless you *import* the CSV file!

    In my Day Job, I often have to work with CSV files which contain job codes which sometimes start with zero — like “08124500” and similar. If I just double-click that file and open it in Excel, well, those leading zeros will always go bye-bye.

    If that’s not what I need (and usually it isn’t), then the only way around it is to open Excel on its own, and then import the CSV file the, uh, slow way.

    (I’m using Excel 2016 currently, but instructions here will be similar for most versions from 2010 and later.)

    1. Open Excel; i.e., a new blank Excel file.
    2. In the Office ribbon, choose the DATA tab.
    3. Look for a section of the ribbon named “Get External Data.” Click the “From Text” button.
    4. Button - From Text

    5. A file selection window titled “Import Text File” appears. Navigate that to your CSV file. Click IMPORT.
    6. Excel will walk you through the multi-step file import. The important thing here is Step 3. Click the column with the leading zeros, and set its Data Format as TEXT, rather than GENERAL.
    7. When Excel imports your CSV data, the leading zeros will still be in place!

    So remember: When bringing CSV data into Excel, you have to account for the fact that Excel will always try to figure out what type of data you have — and to Excel, “08253641” sure looks like a number. Which means the leading zero will be dropped. And if Excel guesses wrong, you might have big problems!


  2. Excel or Access?

    It was a hard truth to learn, and it took years for me to learn it, but facts is facts:

    There are times when Excel just isn’t the right tool for the job.

    Now, Excel and I get along swimmingly. I’ve devoted hundreds of hours to learning its “ins and outs,” and I regret none of that. To this day, I still get a little giddy when I discover a new function that’ll be useful to me somehow.

    But darn it, Excel just isn’t the right tool for managing data … especially if it’s relational data. (“Relational data” meaning that data in this table over here has a specific relationship to data in that table over there … and maybe even more tables of other data beyond that.)

    Excel Was My Best Friend.
    Access Was a Weird Guy Across the Street. (Nobody Talks to That Guy.)

    I can’t remember when I was first introduced to Excel — probably the mid- to late-1990s — but I was a fan from Moment One. I also can’t remember when I was first introduced to Access (the database program Microsoft bundles with its Office suite), but it was probably ten years later, if not more. It took me a long while to figure out why anyone would bother with Access. Excel was SO much easier to learn and implement for whatever tasks I had at hand. In fact, at my Day Job, while Excel licenses were utilized by just about every employee in the place, it wasn’t until a few years ago that Access licenses were made available — and even then it was by request only.

    So without knowing it, early in my career, I was trying to shoehorn Excel into doing data-management jobs for which it wasn’t really built. One particular spreadsheet I created, maintained, and added data to over 15+ years, across multiple worksheets … only to find out last year why it should’ve been exported to an Access (or similar) database long, long ago.

    (When you need to search for, say, multiple part numbers across about 20 separate worksheets, you figure out pretty fast just why a good relational database is as valuable as it is. And why Excel isn’t good for that AT ALL.)

    So now I have this Excel spreadsheet with 15 years of work-related data crammed into it. It’s not unusable by any stretch, but depending on the searching that needs to be done, it can be, uh, ungainly. At best.

    For THAT data-management job, I should’ve used Access. I’d be much better off now.

    Excel vs. Access: Which Tool for the Job?

    So, having lived and learned, here are MY thought processes for deciding whether to use Excel or Access for any given job:

    • If it’s a numbers task, and you want pretty charts and complex calculations run on the data, then Excel.
    • If it’s a flat-file, one-table sort of database, then either Excel or Access might do the trick.
    • If it’s a multi-table database with no relationships between tables, then Access is probably a better choice. But Excel could be workable. (Especially if complex searching is not required.)
    • If it’s a data-driven task, which will rely on text, numbers, text and numbers, or other file types being accumulated, modified, and analyzed over time, then Access.
    • If you need to implement strict controls on non-numeric data which users enter and/or modify, then Access.
    • If your data needs to have relationships (e.g., this table shows part numbers, and that table shows work operations, and the two tables are somehow “related” in use and/or search-ability), then Access.
    • If the end result of your data requires complex queries, searches, and filters, then Access.

    Note that these aren’t hard/fast rules. They’re just how I approach the problem now. You see, I’m all the time watching folks try to make Excel handle jobs which would be much better suited for a database program of some sort. But suggesting such a thing (“What? But I already know Excel!”) is almost always dismissed out-of-hand. At some point, I’m afraid, they’ll be sorry.

    Hey — just because you CAN whack a nail into a two-by-four with a heavy Swingline stapler doesn’t mean that’s the way you OUGHT to do it.

    ASIDE: Hey, people look at me like I’m nuts when I tell them that Quicken is 80 percent database, 5 percent math and calculations, and 15 percent bloat and unnecessary features. But it’s troof. Quicken’s database back-end is the workhorse!

    Here, by the way, are Microsoft’s thoughts on the issue:

    Office.com: Using Access or Excel to Manage Your Data

    Much wordier than mine, but very thorough, and worth a read-through.


  3. Excel: Create Drop-Down Menus

    Thanks to my popular Excel page, I’ve gotten several questions recently about how to create drop-down menus in Excel. Yes, a quick Google search for “Excel drop-down list” or similar would likely educate most folks well enough, but I’ve haven’t posted in a long while … and this seems like a fine little tutorial to add to my collection.

    NOTE: I’m using Excel 2010 for this tutorial. Instructions would be pretty much the same for Excel 2007 and later versions.

    Excel Feature: Data Validation

    The feature in Excel that allows for us to use drop-down menus in cells is called Data Validation.

    Data Validation

    In truth, Data Validation allows a spreadsheet creator to control all kinds of things about what the user might enter in cell or group of cells. But when it comes to creating a drop-down list for users to choose from, well, that’s where lots of questions tend to arise.

    So let’s pretend that we have a spreadsheet in which we want our users to enter, in Cell B6, one of four choices:

    • Visa
    • MasterCard
    • American Expresss
    • Discover

    First, we need to put those options somewhere in our spreadsheet for Excel to find. So I’m going to enter our “list” of options in Cells A1 through A4:

    Data Validation - Create a List

    Note that I don’t have to create my list of options in the same worksheet; it could be in a different worksheet, too, and in any group of consecutive cells you like. The list can also be in hidden rows; that’s what I end up doing most often in my own spreadsheets.

    Now that we have our list, and with Cell B6 as our active cell, we’ll do the not-so-hard part:

    1. In the Excel ribbon, select the DATA tab.
    2. Click the DATA VALIDATION button.
    3. In the SETTINGS tab, find the “Allow:” box, and select “List.”
    4. Now, below that, in the “Source” field, we’ll tell Excel where to find the list of choices we want users to have. In this case, our list is in the area defined by $A$1:$A$4. (The dollar signs tell Excel that these are absolute references to those rows and columns.)

    5. In the “Source:” field, type “=$A$1:$A$4” and then click OK.

    And just like magic, you’ll see the drop-down menu indicator next to Cell B6. Click that, and our four choices appear in a drop-down menu:

    Data Validation - Drop-Down Menu

    And that, folks, is all it takes to create a drop-down list in any cell (or cells) of your Excel spreadsheets!


  4. Money Duality: Using Quicken and YNAB 4

    Back in February, I began making myself do twice as much work when it comes to managing our money.

    Why would I do this?

    In short: Because, even after eleven updates, Quicken 2013 is an unmitigated disaster.

    Quicken: Can I Get Along Without It?

    Quicken 2013 has now gone through eleven updates, and it’s still craptastic. My beloved “What’s Left” report …

    In / Out / What's Left

    … doesn’t register certain savings transfers once they’re entered. (As long as they’re just scheduled transactions, they show up fine). It doesn’t count “Employer Contributions to 401k” as income, but does count them as outflows when they’re transferred to my 401k account. Say what?

    And though it’s been revamped, Quicken 2013’s budgeting feature is still useless: I literally cannot determine where I stand for the current month as regards “Actual” spending, as it doesn’t tally any of my income at all in its bottom-line numbers.

    Sure, the register and account views of Quicken are still good. But otherwise, this is Total. Software. Fail.

    I went so far as to start an entirely new Quicken datafile, too, to see if that cleared up any of the issues. The answer? It cleared up one big issue, which was having Scheduled Transactions vanish once I set them to enter into my account registers. (I used the clean datafile throughout the month of February, and no transactions disappeared during that time, or during my first March bill-paying session.)

    At this point, I’d reasonably say that I’m as frustrated with Quicken 2013 as I’ve ever been, with any software.

    However, after using Quicken for so many years, the question of “Can I get along without it?” isn’t an easy one to answer. I always said that if I ever decided to dump Quicken, it’d be for YNAB. This hasn’t changed now that YNAB 4 is out; my YNAB 4 review is absolutely glowing. It is a fantastic piece of software.

    But for tracking all sorts of accounts, from retirement to stock-trading to just plain asset-value accounts, YNAB 4 isn’t Quicken. And Quicken’s reporting abilities are second to none.

    Can I get along without those things? I don’t know.

    But I am going to use both programs for a while, and see how it goes.

    Doing It All Twice

    There’s no doubt about it: Doing everything twice is a pain in the butt. February proved that to me.

    Since I enter all transactions by hand — no bank downloads for me! — and reconcile all accounts when statements arrive, doing all our monthly money-work twice is no small task.

    I have lots of accounts which I track in Quicken for net-worth purposes, but didn’t add to YNAB. I like to see my accounts segregated into more than two groups; YNAB has only “Budget Accounts” and “Off-Budget Accounts,” whereas Quicken allows for “Banking,” “Investment,” “Property & Debt,” and “Separate” groupings.

    Thus, precise net-worth tracking in YNAB 4 is a non-starter. But that’s not really what it was built to do. It was built for budgeting supremacy …

    … and it delivers that in spades.

    And since Quicken’s “What’s Left” report — which I depended upon for budgeting purposes — is now blown to heck, I shall have to rely on YNAB for cash-flow planning.

    When used for that task, YNAB is a true joy to behold.

    At some point, I’ll have to decide what I’m willing to give up: vast account-tracking abilities (Quicken), or heavenly cash-flow planning (YNAB).

    Because I don’t think I can keep doing twice the work forever.


  5. Quicken 2013: It Isn’t Good.

    I’m now about one month into my foray with Quicken 2013 Deluxe (upgraded from Quicken 2010 Deluxe), and the results are …uh … less than optimal.

    In other words, this program is a mess.

    In addition to the cash-flow-tracking problems mentioned earlier, I’m now having Recurring Bills VANISH ALTOGETHER when I click to enter them. My monthly cable bill, for example, when I clicked its ENTER button in the “Bills” tab … well, not only did it not appear in my register, it disappeared entirely from the bill list, too.

    Not good. Not good at all.

    I’ve spent years using Quicken, and generally defending it against detractors, but this is not acceptable. I’ve never once utilized Quicken’s transaction-download features, simply because of all the horror stories (former) Quicken users told, and in my mind I just blew these problems off. Entering all transactions by hand? No biggie. It’s what I’ve always done anyway.

    But to have a feature so basic as Recurring Bills blow up like this? On a Quicken release that’s been through 10 updates already? All while the folks at Intuit can’t come out with more crap features fast enough every year?

    Totally. Not. Acceptable.

    My Quicken use dates back to the mid-1990s, 3.5″ disk days.

    At this point, my continued support of Quicken is tenuous. At best.

    YNAB 4 is looking better and better.


  6. Quicken 2013: Budgeting Woes

    It was mid-January when I pushed Quicken Deluxe 2010 aside, and upgraded to Quicken Deluxe 2013. Thirty or forty minutes in, and I already had a bad feeling that this particular upgrade wasn’t going to be one that made me smile.

    I’ve been a devout Quicken user since the 1990s, with upgrades done typically every two or three years. It was Quicken Deluxe 2010’s “In / Out / What’s Left” feature …

    In / Out / What's Left

    … which finally allowed me to break away entirely from keeping separate budgets in Excel. I couldn’t tell whether this tool was still around in Quicken Deluxe 2013, as the packaging didn’t show it, but I went ahead and took the leap. Hope and prayer, and all that.

    “In / Out / What’s Left” Is Still There

    Yes, the “In/Out/What’s Left” chart is still in Quicken 2013 Deluxe, but it doesn’t show by default (as it did in 2010). Plus it’s pretty well hidden. It took me several weeks of sorta/kinda searching to figure this out. I will say that, until I found the darn thing, I was a sad, sad man whenever it came time to fire up Quicken and punch in some transactions.

    To get the “In/Out/What’s Left” view to appear on your Home desktop:

    HOME tab → Home button → Customize button → in “Available Items” window, scroll down to Planning section → select “In/Out/What’s Left” → click ADD.

    See? Just like that, I had my beloved “What’s Left” cash-flow tool back, and all was right with the world.

    Kind of.

    Quicken’s Budgeting Tool Gets Another Look

    I’ve stated in the past that Quicken’s budgeting features are miserable. Up to this point, if readers ever emailed me, asking for my opinions on budgeting tools, I’d inevitably point them toward Excel (“Make your own budgeting spreadsheet, or use one of mine“) or YNAB.

    It appears that Intuit really tried to revamp their budgeting tools in Deluxe 2013, which was a fine idea. The fact that I can see a year’s worth of spending and budgets at once is quite lovely:

    Quicken's Budget

    And by “lovely,” I mean it’s a good thing to see an annual budget breakdown once you’ve spent hours upon hours getting Quicken tweaked to show things correctly. Because if you don’t, you’ll find yourself and your budget in some time-warp, federal-government “minus equals plus and red means overspending and red is good” bizzaro money world.

    So yes, I still assert that YNAB’s budget setups make Quicken’s look, sound, and smell like utter crap. But in this arena, any progress (for Intuit) is good progress.

    Sadly, even with the revamp, I still can’t say much for Quicken’s budgeting prowess overall.

    Clunky, Clunky, Clunky

    Much like a pissed-off porcupine, Quicken’s budget is hard to handle. Selecting categories to include in your budget is a serious time-sink, for one thing.

    It’s worth noting here that Quicken’s budget can and will start right from Penny One of your previously set up paychecks. So if you’re one of those dorks who, like me, tracks your income from its pretax levels, all the way down through taxes, deductions, and everything else, you’re going to have a jolly ol’ time slogging through this as it relates to your budget(s).

    How do I know? Because I spent weeks kludging my way to what I already knew was my baseline “available to budget” amount, all because Quicken was applying my 401k employer-match amounts to the expense side of the budgeting ledger (because I want transfers to my 401k to count as a budgeting outflow) … but it wouldn’t count the initial employer-match “income” on the income side of things. Thus my “Remaining to Budget” amount appeared smaller than it really was. And figuring out why it refused to count the income was perfectly maddening.

    Turns out that, to rectify this, I had to figure out how Quicken was categorizing the employer-match money behind the scenes — and “_401 Employer Contrib” is the correct answer, kids. Then, for this category to even be made available in your budget, you have to checkmark “Show hidden categories” at the very bottom of the “Select Categories to Budget” form.

    Finding the category...

    And of course, because it would make NO SENSE WHATSOEVER to place “_401 Employer Contrib” in the “Personal Income” category group, you have to spend time scrolling through roughly 4,267,184 other categories in the “All Categories” group to find “_401 Employer Contrib” way down near the bottom of the list.

    Egads.

    Well, at least now, after several weeks, I’ve got Quicken’s budget set up to at least show me good “actual” spending numbers. I haven’t even approached the “budget” inputs yet. Should I desire to plan our income and spending months in advance, I think Quicken can make it happen. The question is: What Quicken budget idiosyncrasies have I not yet discovered? You just know there’ll be more.

    Only time will tell.


  7. 8 Tips for Building a Better Spreadsheet

    Being a financial dork of the highest order, it should go without saying that I love spreadsheets. And I particularly enjoy the process of building good, useful ones.

    Having been a spreadsheet aficionado for many years now, I thought it might be fun to scribble down a few of the “rules of thumb” for spreadsheet creation which I’ve learned over this time.

    (Not only do I make free and for-pay financial spreadsheets for web surfers at large, but my Day Job involves lots of spreadsheet use, too. And many of these spreadsheets get distributed throughout the company, for use by everyone from fresh-faced newbies to blurry-eyed Excel veterans.)

    That said, here are a few of my personal “Rules for Creating Spreadsheets That Don’t Suck.”

    Tip #1: Spreadsheets For You ≠ Spreadsheets You Distribute

    You might be able to get away with leaving cells unlocked (and the worksheet unprotected) in a spreadsheet you make for your own use, since you as Spreadsheet Creator presumably know what goes where. But that won’t fly with spreadsheets that you distribute for use by others.

    There’s just no telling what someone else will type, nor where they’ll type it. Let’s face it: Stray key-punches are a fact of life. Get a homeless [SPACEBAR] entered into a vital, formula-holding cell, and an entire spreadsheet can detonate.

    And that ain’t good.

    So be sure to unlock ONLY those cells where users are expected to enter data…

    … and then PROTECT that worksheet!

    Tip #2: Appearance freakin’ matters.

    We’ve all seen them: Spreadsheets emailed to us by coworkers with NO idea of how to arrange and design data in a way that makes sense. Cell text overruns gridlines like snakes dumped on a chessboard; instructions are vague at best; you couldn’t make the page suitable for printing if you taped three sheets of legal paper end to end. What goes where? What’s that army of “#####” symbols in Column G supposed to signify? Should I enter new data in Cell R3, or not? Good luck figuring all this out without going thru every cell by hand … and taking notes.

    Yeah. So, without any sort of cell formatting (read: background colors, borders, and so on) and coherent design to guide us, the actual usability of Coworker’s Latest Creation plummets so fast that it takes an act of God to keep this Excel disaster from being clicked ‘n’ dragged to a Recycle Bin demise.

    In other words, appearance matters. A little cell formatting — often as simple as some understated background colors in those cells where data should be user-entered, with white for everything else — goes a long, long way. The latest versions of Excel provide a metric crap-load of tools to make your spreadsheets look decent. CELL → FORMAT is nothing to be afraid of, you know.

    In other words, the best spreadsheets are a joy to look at, and work with. And the BEST best ones don’t look like spreadsheets at all.

    Tip #3: Gridlines Are Bad. White space is good.

    Plus, it’s easy on your printer. So use it liberally.

    (This includes getting rid of gridlines, and instead manually creating cell borders when necessary. Unused oceans of gridlines are the devil.)

    Tip #4: Color is most effective when used sparingly.

    Remember what I said about using color above? Well, don’t go overboard with that. Personally, I like to color (and unlock!) only those cells where users will need to enter data. All other cells are left white. (And locked!)

    Tip #5: Provide Detailed Labels and Notes…

    Thinking a field is “self-explanatory” courts disaster. You pretty much have to get inside the user’s mind and consider this stuff; you ponder what they’ll be thinking and seeing and deciding. Any guidance you can give that helps get the user’s Datapoint A into the correct cell will pay off big.

    Tip #6: …But Remember That Most People Don’t Read.

    Nobody reads a darn thing anymore. I’m fairly confident that 99% of users start hammering numbers into most spreadsheets without throwing so much as a glance as the “Instructions & Notes” worksheets I almost always provide. But that’s the world we live in.

    Build with the 99% in mind, but put some time into decent worksheet notes, too. Appreciate the 1%.

    Tip #7: Gonna distribute? Use version numbers!

    This is most applicable if you’re building spreadsheets for business use, where more than one person will be using the program. But it can also be helpful if you’re distributing your Excel creations on the internet.

    By applying version numbers to your spreadsheets, you make it easier for users to know which iteration they’re working with. It also makes it a snap to determine if the spreadsheet version that Ron, your nosey coworker in Cubicle B3, is working on is newer and better than yours.

    Tip #8: When possible, place column SUM formulas at the top of the data they tabulate.

    This is kind of a little thing, but man, has it made my spreadsheeting life easier.

    One of the great features of spreadsheets is their ability to analyze ever-changing amounts of data. However, when you build a spreadsheet to account for, say, a column with 100 rows of data which need to be totaled up, you might as well plan on that spreadsheet someday needing to total up 200 rows instead. So to make such a change easier, put your SUM formulas ABOVE the column’s uppermost data cell.

    I know that for myself, it’s almost instinctive to want to total up columns (when that’s what is required) at the bottom of the current data. (Thanks, every math teacher I ever had!)

    Here’s an example:

    However, placing the TOTALS (or whatever formula you need) at the top of each column’s data makes it much easier to expand your data “downward” later:

    With formulas at the column tops, you won’t have to go to the trouble of inserting rows (and possibly hosing your formulas) later on, when the need for more data becomes official … as it seemingly always does.


  8. Effective Tax Rate, 2010 Edition

    Each year, once I’ve completed and filed our income taxes, I like to spend a little time calculating my household’s effective tax rate. What’s an “effective tax rate,” you ask?

    Well, it’s a way for me to get outside of the usual “What tax bracket are you in?” thinking that so many folks seem mired in. Yes, income-tax brackets get all the media focus and hubbub, especially when tax rates change, but last time I checked, I pay more taxes than just the “income” variety.

    Since income taxes are really only part of our overall, real-world tax picture — think Medicare taxes, Social Security taxes, property taxes, and so on — it strikes me that figuring a more comprehensive “effective tax rate” gives a much better feel for how much of our money is really going out the door to the Tax Man.

    What’s Included in ETR?

    When I calculate my effective tax rate (“ETR,” for short), I start by figuring out my household’s gross annual income. That includes total wages and salaries (Form W-2, Box 3), interest earnings, non-retirement-account investment income, and any other sideline income that existed for that tax year. Added together, all those items get me the “Gross Income” figure for my formula below.

    On the taxes-paid side of things, I tally up our federal income taxes paid (Form 1040, Line 60), minus any credits below that line — the last two years’ “Making Work Pay” credits would qualify here. Added to that are state income taxes paid (if any), Social Security taxes, Medicare taxes, and any property or local taxes that I forked over during the year. If I have any excise or other taxes that I paid during the year, I lob those in here, too.

    Since I do separate some of my utility-bill taxes in Quicken, those figures go here, as well.

    What About Sales Taxes?

    Yes, to get a true tax picture, the year’s cumulative sales taxes also should get figured in.

    However, tracking sales taxes in Quicken with any sort of precision would mean that most every transaction becomes a split. Whilst I love me some in-depth financial data, I’m just not gung-ho enough to go that far. You gotta draw the line somewhere, right?

    (My annual use taxes do get figured in, though, because they’re included in the amount shown on the tax-form line I use for my Oklahoma “state taxes paid” above.)

    Initially, I planned to omit sales taxes altogether. But as I wrote this, it occurred to me that I could simply fire up an annual cash-flow report in Quicken, export it to Excel, and remove all categories that either (1) aren’t sales-taxable, or (2) already had use tax paid applied. I could take the remaining categories and do a little math on them.

    So I did. Figuring a rough estimate of total sales-taxes paid wasn’t too hard, with exception of auto fuel and its “cents-per-gallon, plus X percent sales tax” setup. Everything else? Pretty simple.

    For instance, our sales-tax rate on groceries was 8.25 percent, and we spent $5,332 on groceries last year, taxes and all. We can estimate that $406 of this was due to sales tax. [5332 − (5332 / 1.0825) = 406]

    Once I dumped that Quicken report into Excel, and autofilled the correct formulas, the sales-tax math was a breeze.

    (Yeah, over time, changes in sales-tax rates will complicate this. But again, all I’m looking for is a rough estimate!)

    A Tax Rate That’s “Effective”

    Once all those items are tallied up, the rest is easy:

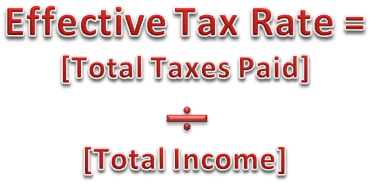
    And that’s all. Take your [Total Taxes Paid] amount, and divide it by your [Total Gross Income] amount. The rate that results is your Effective Tax Rate.

    Now, I’ve been calculating my effective tax rate for years, though prior to 2010 I focused only on income taxes. Because I’m a dork who finds such comparisons fun, I tried to standardize things a bit this year so that I could go backwards through our tax returns and see how our ETR — now expanded to include all the other taxes we pay — has changed over time.

    2010 Effective Tax Rate: 21.9%

    So, for tax year 2010, roughly 21.9 percent of our income went toward taxes of one kind or another. For 2009, our effective tax rate was 21.5 percent. And back in 2008? A bit higher, at 23.9 percent.

    Summary

    For a while now, I’ve really preferred to think of my tax burden in terms of this overall “effective tax rate,” rather than in terms of federal and state tax-bracket rates … which is what so many people do. Income taxes are only part of the picture, after all. Until you look at your tax burden in total, taking into account all the directions from which the Tax Man gets into your wallet, then it’s pretty easy to miss the immense impact that taxes have on your total financial picture.

    As the figures above show, I might be in the 15 percent federal tax bracket … but that sure doesn’t mean I’m handing a mere 15 percent of my income to the tax authorities!


  9. Excel: Keyboard Shortcut to End of Column

    A purchaser of my Check Register spreadsheet recently emailed me, asking if there was a quick way to get to the bottom of her register — to get to the first blank row, in other words, in order to quickly add a new transaction. When you have five hundred transactions in your register, scrolling all the way to the bottom of your data so you can enter a new transaction … well, it just ain’t a lot of fun.

    Now, Excel has always had lots of keyboard shortcuts. The one that’s most applicable here would be the [CNTRL]-[DOWN ARROW], or [CNTRL]-↓, shortcut.

    Getting to the Bottom of It

    When I press the [CNTRL]-↓ combination, Excel will automatically take me down to the last nonblank cell in my current, active column. So, in the case of my Check Register spreadsheet, placing Excel’s cursor in any cell in the DATE column (Column C), and then pressing [CNTRL]-↓, will take me to the last nonblank cell in that column.

    From there, a single arrow-down keypress gets us to the next blank row, and we’re ready to enter the new transaction. No scrolling involved!

    (Conversely, pressing [CNTRL]-↑ would take you to the topmost nonblank cell in your current column.)


  10. Handling Paypal Refunds in Quickbooks

    Back in January, I wrote a post about how I handle Paypal transactions in Quickbooks. A reader inquired as to how I handle Paypal refunds in Quickbooks, so here’s a quick run-through. Grab some popcorn, kids.

    Quickbooks And Credit Memos

    Since Quickbooks won’t allow us to record a negative-amount sales receipt or invoice, we have to create a Credit Memo when we need to issue a refund.

    For the purposes of this lesson, let’s assume I need to refund in full the sales receipt (pdf) I showed in my previous post. On it, customer Mary McDoodle bought a $9.95 Kafluder valve, purchased via Paypal. Accounting-wise, I absorbed the 59-cent Paypal fee inside the same receipt, setting it up as an “Other Charge” in Quickbooks. This way, the total of the sales receipt reflected exactly what I saw when I looked at the transaction in my Paypal account; i.e., a net income of $9.36:

    Paypal Register Before Refund

    Now I need to refund Ms. McDoodle. Here’s how it’s done.

    Step 1: Set Up a Credit Memo

    On my Quickbooks desktop, I’ll click the “Refunds & Credits” icon. (You could also get to this by clicking CUSTOMERS in the menubar, and then selecting CREATE CREDIT MEMOS/REFUNDS from the dropdown menu.)

    This opens up a new Credit Memo form. It’ll look much like any other sales-receipt or invoice form you might see in Quickbooks.

    Once the Credit Memo form is open, fill it out so that it matches the receipt or invoice you’re refunding. In other words, enter the same items, in the same quantities, at the same prices. This includes the Paypal fee “Other Charge” item, if you’re entering them inside each receipt the way I do.

    Let’s take a quick look back at how I entered Ms. McDoodle’s initial sales receipt:

    McDoodle Sales Receipt

    And its accompanying Transaction Journal:


    Now for the Credit Memo. Here’s how it will look:

    McDoodle Credit Memo

    Note that I entered the same Items, quantities, and amounts in the Credit Memo as I did in the sales receipt. The Paypal fee is there because Paypal refunds it to me (the seller) when I process the refund in Paypal’s system, which I’ll do manually, outside of Quickbooks.

    When I save the Memo, Quickbook basically “reverses” what’s on it. At least, that’s how I think of it!

    Step 2: Apply the Credit Memo

    So we’ve created Ms. McDoodle’s Credit Memo. Note that nowhere in the Credit Memo form does Quickbooks ask us for the posting account (as it does in sales receipts). That’s because we could do different things with Credit Memos; we could:

    • Allow the customer to “retain” the available credit for later use;
    • Give a refund; or
    • Apply the credit to an invoice.

    When we save/close the Memo, Quickbooks automatically asks which of these options we want to perform. In our case, since we’re refunding the customer via our Paypal account, we’re going to opt to give a refund:

    QB Dialog: Credit Memo Action

    After that, Quickbooks’ “Issue a Refund” window appears:

    QB Dialog: Issue a Refund

    And right there is where we’ll select the account for the refund to come from — which is our Paypal account. One more click of the OK button, and the refund is posted. My Paypal account register shows:

    Paypal Register Shows Refund

    And that’s it — we’re all done with posting the Paypal refund in Quickbooks!