1. Employers Turn Small Loans Into Savings

    Now here’s a PBS video which I think illustrates at once a horrific concept, and a fabulous one:

    PBS: Savings and Loans: Employer Plans Encourage Saving (~12 minutes)

    What’s horrific? People borrowing money from their employers. Now, if your employer’s a bank, then hey, fine, whatever; it’s what they do. When all hell blows up on them, taxpayers pick up the tab, and no one much gives a crap after a year or so. (Especially if the stock market is tagging record highs.)

    Outside of that, if your employer isn’t a bank or similar, then they shouldn’t be in the business of making loans. Just my opinion. That’s what banks, credit unions, pawn shops, check-advancers, and your neighborhood loan shark are for. Though of course it’s the employers’ money, and they can do with it what they want. (In the video, the employer is more “facilitating” the loans than they are “making” them. The loans are actually made by local credit unions, with interest rates in the 17 percent range.)

    In my modest personal experience, watching how these sorts of employer-as-lender policies are treated in workplaces, I’ve found that even when these loans turn out well, they tend to be used by the same folks again, and again, and again. Maybe I’m wrong, but I don’t think that’s the goal.

    The Part I Applaud

    In the video, we’re told that the employers in question made an interesting policy tweak: Loan payments are withheld directly from employees’ paychecks over time, and once the loans are paid back, the default option is for employees to continue having those same amounts withheld, but deposited into savings accounts so that they begin building savings. Employees can opt out of this “forced” Baby Step #1, of course, but most (we’re told) do not.

    This part of the plan, I adore.

    By the time the loan is paid back, I’d imagine that you as employee would have at least a decent chance of realizing that you really COULD live without that small chunk of your paycheck. It wasn’t so hard, was it? Lo and behold, the saving you thought you could NEVER EVER do turns out to be achievable — cold, hard cash in a bank account. When the next little emergency pops up, perhaps you’ve got it covered.

    (Though I’d argue that the peace of mind savings provides is probably worth as much as the actual money itself. And the less someone has experienced actual “saving,” the more important that peace of mind is.)

    Given the context that’s presented in the PBS video, I might be willing to revisit my “Employers shouldn’t be making loans” stance. I could see where both parties really could benefit from such an arrangement.




  2. We Learn Nothing

    Yes, it’s a current article:

    Herald Tribune: Admin Aims to Increase Loans for Homes

    From the story:

    President Barack Obama’s economic advisers and outside experts say the nation’s much-celebrated housing rebound is leaving too many people behind, including young people looking to buy their first homes and individuals with credit records weakened by the recession.

    In response, administration officials say they are working to get banks to lend to a wider range of borrowers by taking advantage of taxpayer-backed programs — including those offered by the Federal Housing Administration — that insure home loans against default.

    I should probably just stop reading the news altogether. Everything I read just about sends me over the edge these days.

    We (deliberately) learn nothing.


  3. Get More Retirement Savings, Cuz Congress Wants It

    Couple of saving-related news stories which hit my inbox this afternoon:

    EBRI: 2013 Retirement Confidence Survey Results

    EBRI’s 2013 survey tells us that half of workers reported having $25k or less in total savings and investments (not counting home equity and any defined-benefit plans). Twenty-eight percent have less than $1,000.

    FA Mag: Congress May Act to Stem Outflows from 401k Plans

    That’s right, America: Not only do you not have jack squat in your retirement plan accounts, but what you do have, isn’t really yours, and won’t be until Congress says it’s okay for you to have it.

    Carry on.


  4. Money Duality: Using Quicken and YNAB 4

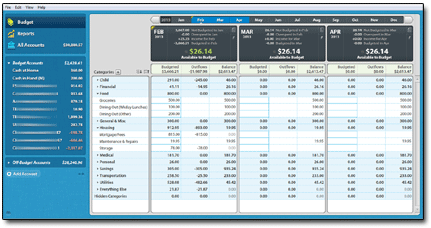
    Back in February, I began making myself do twice as much work when it comes to managing our money.

    Why would I do this?

    In short: Because, even after eleven updates, Quicken 2013 is an unmitigated disaster.

    Quicken: Can I Get Along Without It?

    Quicken 2013 has now gone through eleven updates, and it’s still craptastic. My beloved “What’s Left” report …

    In / Out / What's Left

    … doesn’t register certain savings transfers once they’re entered. (As long as they’re just scheduled transactions, they show up fine). It doesn’t count “Employer Contributions to 401k” as income, but does count them as outflows when they’re transferred to my 401k account. Say what?

    And though it’s been revamped, Quicken 2013’s budgeting feature is still useless: I literally cannot determine where I stand for the current month as regards “Actual” spending, as it doesn’t tally any of my income at all in its bottom-line numbers.

    Sure, the register and account views of Quicken are still good. But otherwise, this is Total. Software. Fail.

    I went so far as to start an entirely new Quicken datafile, too, to see if that cleared up any of the issues. The answer? It cleared up one big issue, which was having Scheduled Transactions vanish once I set them to enter into my account registers. (I used the clean datafile throughout the month of February, and no transactions disappeared during that time, or during my first March bill-paying session.)

    At this point, I’d reasonably say that I’m as frustrated with Quicken 2013 as I’ve ever been, with any software.

    However, after using Quicken for so many years, the question of “Can I get along without it?” isn’t an easy one to answer. I always said that if I ever decided to dump Quicken, it’d be for YNAB. This hasn’t changed now that YNAB 4 is out; my YNAB 4 review is absolutely glowing. It is a fantastic piece of software.

    But for tracking all sorts of accounts, from retirement to stock-trading to just plain asset-value accounts, YNAB 4 isn’t Quicken. And Quicken’s reporting abilities are second to none.

    Can I get along without those things? I don’t know.

    But I am going to use both programs for a while, and see how it goes.

    Doing It All Twice

    There’s no doubt about it: Doing everything twice is a pain in the butt. February proved that to me.

    Since I enter all transactions by hand — no bank downloads for me! — and reconcile all accounts when statements arrive, doing all our monthly money-work twice is no small task.

    I have lots of accounts which I track in Quicken for net-worth purposes, but didn’t add to YNAB. I like to see my accounts segregated into more than two groups; YNAB has only “Budget Accounts” and “Off-Budget Accounts,” whereas Quicken allows for “Banking,” “Investment,” “Property & Debt,” and “Separate” groupings.

    Thus, precise net-worth tracking in YNAB 4 is a non-starter. But that’s not really what it was built to do. It was built for budgeting supremacy …

    … and it delivers that in spades.

    And since Quicken’s “What’s Left” report — which I depended upon for budgeting purposes — is now blown to heck, I shall have to rely on YNAB for cash-flow planning.

    When used for that task, YNAB is a true joy to behold.

    At some point, I’ll have to decide what I’m willing to give up: vast account-tracking abilities (Quicken), or heavenly cash-flow planning (YNAB).

    Because I don’t think I can keep doing twice the work forever.


  5. Half Living Paycheck to Paycheck

    Fresh new survey data from Allstate’s “Life Tracks” unit suggests that about half of Americans have nothing left over after paying for essentials:

    Allstate: Americans Struggle to Save Despite Optimism

    I find it interesting that this “half of us live paycheck-to-paycheck” stat keeps reappearing in survey after survey in recent years. I’m thinking the figures are pretty valid, at this point.

    In the Allstate survey, conducted in December of 2012, 32 percent of college grads reported living paycheck-to-paycheck, while 48 percent of non-graduates reported the same.

    For those curious about credit-card debt, there were some interesting nuggets in that arena, too. From the article:

    • Forty-nine percent say they pay credit card debt; 43 percent mortgage payments; 36 percent car payments; 17 percent student loan payments; and 15 percent medical debts.
    • Among the half (51 percent) of Americans expecting a tax return, 45 percent intend to pay off debt with the money.
    • Sixty-five percent of Americans with credit card debt say their level of debt has increased or remained the same in the past year.
    • While a majority say their savings remains about the same (about 60 percent) in the past year, just 15 percent of Americans say their short-term emergency savings has increased, and 14 percent say their long-term savings and investment activity has increased.

    The fact that 65 percent said their debt levels have stayed the same or increased in the last year isn’t a surprise, given that 40 percent of respondents were “very confident about their ability to pay for a new car.” (That was in the survey, too.)

    What’s implied, of course, is that they’re confident in their ability to borrow for a new car.

    Debt, after all, makes the world go ’round.


  6. K-Cups: Best Prices Update

    Another year (plus) has passed since I last completed my survey of best prices on K-Cups. I had a little bit of free time this weekend, so I took up a bit of price-shopping and research. Scroll down a bit for the results.

    K-Cup Pricing: Some Boundaries

    When it comes to my K-Cup pricing surveys, I try to stick with retailers who are widely-known and very accessible. I don’t consider the impact of sales tax on pricing, since if you’re buying online, you ought to be paying your state’s use tax on those purchases since sales tax often isn’t collected.

    I omitted Sam’s Club from previous years’ lists because their selection has typically been very limited. This year, however, they’re in, since my local Sam’s Club had three varieties in stock when I visited. (One of which — Green Mountain’s Breakfast Blend — I happen to really enjoy. And yes, at $.50/cup, I picked up a box, as it represented a better price than the Green Mountain Cafe Express club pricing I usually get.)

    I include coupon prices for Bed Bath & Beyond because once you get on their mailing list, your mailbox will be perpetually stuffed with BBBY coupons.

    Lots of smaller online stores carry K-Cups, but of the ones I’ve seen, their per-cup prices become significantly higher than those below once shipping charges are tacked on. If one could find a free-shipping offer or two, and a desired flavor came on sale … well, who knows. Perhaps deals could be had, in that case.

    Best K-Cup Prices

    I was surprised to find that pricing hasn’t changed much, if at all, from the 2011 edition. Notably, Target’s prices for K-Cups have dropped by $1/box.

    I don’t drink Starbucks K-Cups, but I think their prices have risen. Where I could find them, Starbucks K-Cups boxes were smaller in count (16 K-Cups vs. 18 K-Cups for most others), and roughly $2 more per box ($12.98 to $14.98, depending on retailer) than other varieties.

    1. Sam’s Club $.4998/K-Cup
    2. Bed Bath & Beyond (w/Coupon for $5 Off of $15 or More) $.5272/K-Cup
    3. Bed Bath & Beyond (w/Coupon for 20% Off One Item) $.5329/K-Cup
    4. Green Mountain (w/Café Express Membership) $.5621/K-Cup
    5. Amazon.com (w/Prime and Subscribe & Save) (50ct.) $.5698/K-Cup
    6. Wal-Mart (Most Varieties / 18ct.) $.6100/K-Cup
    7. Target (Most Varieties / 18ct.) $.6106/K-Cup
    8. Amazon.com (w/Prime) (Most Varieties / 24ct.) $.6379/K-Cup
    9. Amazon.com (w/Super Saver Shipping) (Most Varieties / 24ct.) $.6379/K-Cup
    10. Bed Bath & Beyond (No Coupons) (Most Varieties / 18ct.) $.6661/K-Cup

    For the curious, the spreadsheet with the underlying data is available here.


  7. Quicken 2013: It Isn’t Good.

    I’m now about one month into my foray with Quicken 2013 Deluxe (upgraded from Quicken 2010 Deluxe), and the results are …uh … less than optimal.

    In other words, this program is a mess.

    In addition to the cash-flow-tracking problems mentioned earlier, I’m now having Recurring Bills VANISH ALTOGETHER when I click to enter them. My monthly cable bill, for example, when I clicked its ENTER button in the “Bills” tab … well, not only did it not appear in my register, it disappeared entirely from the bill list, too.

    Not good. Not good at all.

    I’ve spent years using Quicken, and generally defending it against detractors, but this is not acceptable. I’ve never once utilized Quicken’s transaction-download features, simply because of all the horror stories (former) Quicken users told, and in my mind I just blew these problems off. Entering all transactions by hand? No biggie. It’s what I’ve always done anyway.

    But to have a feature so basic as Recurring Bills blow up like this? On a Quicken release that’s been through 10 updates already? All while the folks at Intuit can’t come out with more crap features fast enough every year?

    Totally. Not. Acceptable.

    My Quicken use dates back to the mid-1990s, 3.5″ disk days.

    At this point, my continued support of Quicken is tenuous. At best.

    YNAB 4 is looking better and better.


  8. Quicken 2013: Budgeting Woes

    It was mid-January when I pushed Quicken Deluxe 2010 aside, and upgraded to Quicken Deluxe 2013. Thirty or forty minutes in, and I already had a bad feeling that this particular upgrade wasn’t going to be one that made me smile.

    I’ve been a devout Quicken user since the 1990s, with upgrades done typically every two or three years. It was Quicken Deluxe 2010’s “In / Out / What’s Left” feature …

    In / Out / What's Left

    … which finally allowed me to break away entirely from keeping separate budgets in Excel. I couldn’t tell whether this tool was still around in Quicken Deluxe 2013, as the packaging didn’t show it, but I went ahead and took the leap. Hope and prayer, and all that.

    “In / Out / What’s Left” Is Still There

    Yes, the “In/Out/What’s Left” chart is still in Quicken 2013 Deluxe, but it doesn’t show by default (as it did in 2010). Plus it’s pretty well hidden. It took me several weeks of sorta/kinda searching to figure this out. I will say that, until I found the darn thing, I was a sad, sad man whenever it came time to fire up Quicken and punch in some transactions.

    To get the “In/Out/What’s Left” view to appear on your Home desktop:

    HOME tab → Home button → Customize button → in “Available Items” window, scroll down to Planning section → select “In/Out/What’s Left” → click ADD.

    See? Just like that, I had my beloved “What’s Left” cash-flow tool back, and all was right with the world.

    Kind of.

    Quicken’s Budgeting Tool Gets Another Look

    I’ve stated in the past that Quicken’s budgeting features are miserable. Up to this point, if readers ever emailed me, asking for my opinions on budgeting tools, I’d inevitably point them toward Excel (“Make your own budgeting spreadsheet, or use one of mine“) or YNAB.

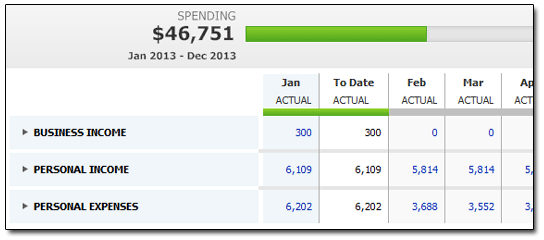
    It appears that Intuit really tried to revamp their budgeting tools in Deluxe 2013, which was a fine idea. The fact that I can see a year’s worth of spending and budgets at once is quite lovely:

    Quicken's Budget

    And by “lovely,” I mean it’s a good thing to see an annual budget breakdown once you’ve spent hours upon hours getting Quicken tweaked to show things correctly. Because if you don’t, you’ll find yourself and your budget in some time-warp, federal-government “minus equals plus and red means overspending and red is good” bizzaro money world.

    So yes, I still assert that YNAB’s budget setups make Quicken’s look, sound, and smell like utter crap. But in this arena, any progress (for Intuit) is good progress.

    Sadly, even with the revamp, I still can’t say much for Quicken’s budgeting prowess overall.

    Clunky, Clunky, Clunky

    Much like a pissed-off porcupine, Quicken’s budget is hard to handle. Selecting categories to include in your budget is a serious time-sink, for one thing.

    It’s worth noting here that Quicken’s budget can and will start right from Penny One of your previously set up paychecks. So if you’re one of those dorks who, like me, tracks your income from its pretax levels, all the way down through taxes, deductions, and everything else, you’re going to have a jolly ol’ time slogging through this as it relates to your budget(s).

    How do I know? Because I spent weeks kludging my way to what I already knew was my baseline “available to budget” amount, all because Quicken was applying my 401k employer-match amounts to the expense side of the budgeting ledger (because I want transfers to my 401k to count as a budgeting outflow) … but it wouldn’t count the initial employer-match “income” on the income side of things. Thus my “Remaining to Budget” amount appeared smaller than it really was. And figuring out why it refused to count the income was perfectly maddening.

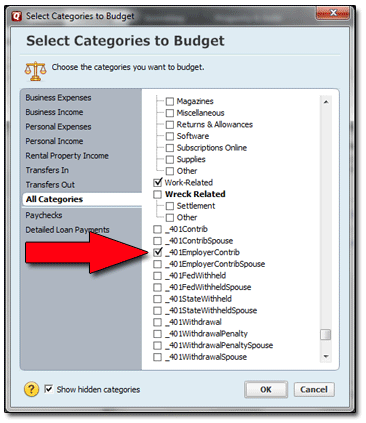
    Turns out that, to rectify this, I had to figure out how Quicken was categorizing the employer-match money behind the scenes — and “_401 Employer Contrib” is the correct answer, kids. Then, for this category to even be made available in your budget, you have to checkmark “Show hidden categories” at the very bottom of the “Select Categories to Budget” form.

    Finding the category...

    And of course, because it would make NO SENSE WHATSOEVER to place “_401 Employer Contrib” in the “Personal Income” category group, you have to spend time scrolling through roughly 4,267,184 other categories in the “All Categories” group to find “_401 Employer Contrib” way down near the bottom of the list.

    Egads.

    Well, at least now, after several weeks, I’ve got Quicken’s budget set up to at least show me good “actual” spending numbers. I haven’t even approached the “budget” inputs yet. Should I desire to plan our income and spending months in advance, I think Quicken can make it happen. The question is: What Quicken budget idiosyncrasies have I not yet discovered? You just know there’ll be more.

    Only time will tell.


  9. Effective Tax Rate, 2011 Edition

    Glancing back through some older posts yesterday, I discovered that I never took the time (last year) to talk about my household’s effective tax rate for 2011. My write-up for our 2010 effective tax rate was the last time I covered this red-hot, bawdry topic.

    Can’t let that stand, now can we?

    Calculating Our Effective Tax Rate

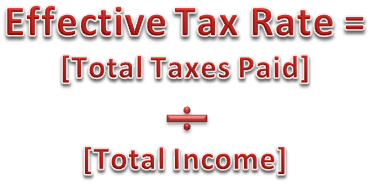
    I won’t spend a lot of time delineating all the numbers which go into our “effective tax rate,” since I covered it pretty in-depth in my 2010 article above. Basically, the formula looks like this:

    On the tax side, all federal taxes are added in there, as well as state taxes, property taxes, utility taxes, and — as best I can estimate from Quicken reports — sales taxes. Same goes for income; it’s all in there.

    Excel Does the Math

    So where’d we end up in 2011? Well, as it turns out, our ETR went back to where it was in 2008:

    And when I say it went “back,” what I really mean is that it went “back up.” Our ETR in 2010 was 21.9 percent, and the year before that, 21.5 percent. So this particular measure of financial progress is going the wrong way, to my thinking.

    Though I’m sure there are many in D.C. (and other levels of government) who are all smiles right about now … now that almost one quarter of our earnings are going into the Tax Man’s pouch.


  10. Survey: Retirement, Medical Costs Concern Americans

    Some meaty survey goodness from late last year:

    Harris Interactive: Americans Worry About Retirement, Health Care

    According to this Harris poll from late 2012, 74 percent of not-yet-retired folks are worried about having enough money to retire (I worry along with them, by the way), and 71 percent of us worry about being able to afford health-care expenses.

    To which I say: What’s the problem? ObamaCare solved all this! Duh! [/sarcasm]

    It’s also noteworthy that 47 percent of respondents said they live paycheck-to-paycheck, and thus are wholly unable to save. Of age group 18 to 47, 53 percent said that paycheck-to-paycheck was a way of life. (This data suggests an economic situation that’s a bit worse than that reported by CareerBuilder, whose 2011 survey found that 42 percent considered themselves to be living paycheck-to-paycheck.)