1. So Why Save?

    Talk about fantastic news: My email inbox showered me with a couple of interest-rate notices this past week … the same sort of notices that have been so pervasive for the last several years:

    Dear Affiliate,

    ING DIRECT’s Orange Savings Account and Kids Savings Account rate has changed to 0.80%.

    ING DIRECT’s Business Savings Account rate has changed to 0.50%.

    Electric Orange Checking Account rates have changed…

    While ING’s savings rates have been below 1% for a while now, and consistently dropping to new lows (for them), the update that really smarted came courtesy of my preferred credit union. Their rewards checking account had been paying me 4.38% ever since I’d signed up back in August of 2010. The new rate as of January 1, 2012?

    Try 3.38%.

    While that’s still a pretty nice rate, relatively speaking, that doesn’t mean I have to be happy about the drop in yield. This is “rewards checking,” after all, where I actually have to expend some effort — like using a debit card at least 12 times per month, which I’d otherwise never do — to earn that rate. And even then, it’s only on the first $15,000 of deposited funds.

    It’s not necessarily the pure dollar figures that tick me off, either. Where my dividends in this account had been running in the $50 area each month, I’ll now be getting somewhere in the vicinity of $42. Eight bucks less per month? No big whoop.

    Rather, what gripes me is the fact that rates are being anchored to the floor, and pushed ever lower, because there’s so much STUPID (yeah, that’s a noun) in the system that allowing rates to rise to a market-clearing level would apparently bring about financial chaos. I mean, heaven forbid true risk get priced in anywhere. Financially-spotty paper assets getting repriced to true, “non-easy money” values? Lord, no! Insanity! Why, think of the children!

    (At this point, Watson, if you’ve surmised that I’m not a fan of the Federal Reserve, you’d be correct.)

    So Why Save?

    It’s quite obvious at this point that, while their PR firms say otherwise, the absolute last thing that The Powers That Be want us middle-class folk to do is save our money. (Neat corollary: One of the reasons we inhabit the economic muck of today is that no one has been saving, really saving, for decades. And if any of us were to do something crazy and start saving now on any kind of sizeable scale, well, we’d be in the soup. Since no one has been saving for years, and instead has been taking on “cheap” debt like there’s no tomorrow, we certainly can’t afford to save now. See how it all makes perfect sense?)

    But if you’re me, and you like to be able to sleep at night, you save anyway.

    You save, because somewhere down the line you’re going to need a new truck, and paying interest on top of the already-silly prices on cars just wouldn’t be kosher.

    You save, because while you replaced your central heat/air system just a few years ago, experience tells you that Murphy likes to show up unannounced and make roadkill of pretty much any four- or five-digit home repair item he can find.

    You save, because deep inside, there’s that vindictive inner self who believes that cramming hundred-dollar bills into a bank bag stored in your home safe means that somewhere, a banker or Federal Reserve governor breaks down in tears. (Or, if you prefer, with each crisp Benjamin you take out of the system, a hefty .0000000137 jobs are destroyed. I don’t have any evidence to back that up, of course, but then my inner self isn’t actually a stickler for facts, either.)

    So go ahead, Federal Reserve, and keep massaging those rates down, down, down. Our beloved banks will have choice but to follow suit. And keep huffing and puffing to prop asset prices up, up, up. There won’t be any negative repercussions to any of this; no, of course there won’t. History has shown us, time and again, that there never are. It always works out well.

    For somebody.

    Just never the savers.


  2. Nope, No Savings Here. Or Here. Or There.

    From DSNews we get this encouraging tidbit:

    DSNews: Job Loss Would Make 1 in 3 Homeless

    And by “encouraging,” I mean that the last thirty years of insane financialization and ridiculous consumption is making itself evident everywhere you turn. While the use of “homeless” in the article is a touch misleading, it still paints a pretty yucky picture:

    One in three Americans would be unable to make their mortgage or rent payment beyond one month if they lost their job, according to the results of a national survey taken in mid-September.

    Despite being more affluent, the poll found that even those with higher annual household incomes indicate they are not guaranteed to make their next housing payment if they lost their source of income. Ten percent of survey respondents earning $100K or more a year say they would immediately miss a payment.

    And this:

    Sixty-one percent of those surveyed said if they were handed a pink slip, they would not be able to continue to make their mortgage or rent payment longer than five months.

    Chalk this up to too many folks borrowing for (or against) homes they couldn’t really afford, and it logically follows that these same households couldn’t build up savings even if they wanted to do so. Throw a dead-weight economy on top of it, and you have the makings of a mighty tenuous situation for a lot of Americans.


  3. Can You Come Up With $2k in a Hurry?

    Sure, the data is a couple of years old, but I don’t doubt it a bit:

    WSJ: Nearly Half of Americans ‘Financially Fragile’

    According to the study, roughly half of Americans reported that they “probably” or “definitely” could not come up with $2,000 if needed within 30 days.

    From the WSJ:

    The survey asked a simple question, “If you were to face a $2,000 unexpected expense in the next month, how would you get the funds you need?” In the U.S., 24.9% of respondents reported being certainly able, 25.1% probably able, 22.2% probably unable and 27.9% certainly unable.

    Other recent, similar surveys have told us that more than 3/4 of us live paycheck-to-paycheck, and 27 percent of us have no personal savings. So it’s not as if this WSJ article’s story is a surprise.


  4. Boomers: Retirement Trouble Ahead

    Ah, the perils of basing one’s retirement on double-digit asset-price appreciation … and carrying large debts in the meantime:

    WSJ: Retiring Boomers Find 401k Plans Fall Short

    Who knew retirement could be so perilous? And who knew it was all the stock market’s fault?

    Bad stock market. Bad.


  5. Harris: 27% of Americans Have No Personal Savings

    If you’re a money-stats junkie like me, you live for figures like these from this recent Harris Poll:

    PR Newswire: More Americans Report No Personal or Retirement Savings

    Amazing, I know. Even though our economy just surged through a dotGov-sponsored Recovery Summer™, it seems that as of November, 2010, fewer of us reported having any personal or retirement savings.

    Here’s one of the survey’s more salient points to consider, if you’re a Gen Xer (as I am):

    Generationally, one-in-four (25%) Baby Boomers (aged 46-64) have no retirement savings, with 22% of Matures (aged 65 and over) stating the same. Gen Xers (aged 34-45) are struggling with more immediate issues; 32% have no personal savings.

    When one in three 34-to-45-year-olds reports having no personal savings, then you know our consume-it-all economic setup is working precisely as designed. And as one of the accompanying tables shows, the same percentage of Gen Xers report having no retirement savings.

    Couple this sort of data with that from other late-2010 surveys — CareerBuilder, for instance, found that 77 percent of us survive paycheck-to-paycheck, even $100k earners — and the picture that emerges is downright scary.


  6. Save Up for Christmas

    It’s time for my yearly admonition:

    Those of you who don’t save up for your Christmas giving by putting aside some cash every month in your Freedom Account — well, all I can say is that you’re probably doing it wrong.

    (On the other hand, if you’re sitting on $10 million in liquid savings AND can manage to NOT piss it all away, then I suppose you can handle your Santa spending however you like, yessir.)

    In any case, the idea is to have your gift money saved and ready to go by the end of November next year. That way you won’t have to rely on FANTASTIC BANKING DEALS like this one:

    Or, even worse, slapping the bills on your credit cards … and letting them simmer for months.

    Even if you can’t be debt-free today, take steps now to make sure that next year’s holiday-season spending won’t dig the hole even deeper!


  7. Quicken: Cash Flow Forecast

    Over the years, Intuit has added lots of tools to Quicken — mostly, I would argue, to encourage its users to adapt an annual upgrade cycle of the software. While I adore Quicken for its performance at tracking accounts, spending, and net worth, I find myself using very few of the additional tools that its Deluxe and Premium versions offer. (As of this post, I’m using Quicken 2010 Deluxe.)

    One such tool — brought to my attention by an email a few months back — is Quicken’s Cash Flow Forecast. It’s meant to help with long-range (say, a year out or more) cashflow planning. Quicken’s Help Files explain it like this:

    For long term forecasting use Quicken’s Cash Flow Forecast feature. A cash flow forecast lets you project your cash flow for the future, based on scheduled bills and deposits and estimated amounts. Quicken can forecast your spending patterns for up to two years, and displays your account balances in a graph.

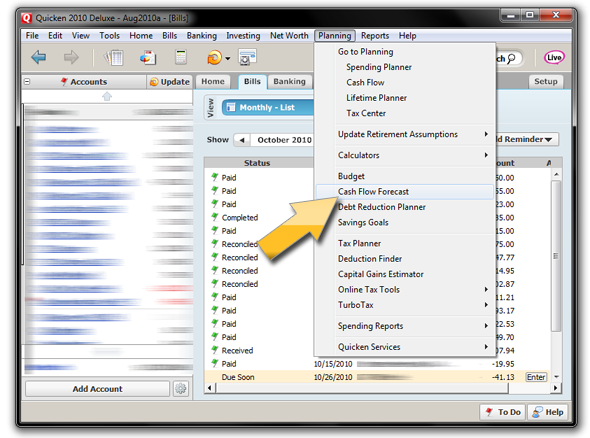
    You can get to the Cash Flow Forecast via the menubar:

    PLANNING → CASH FLOW FORECAST

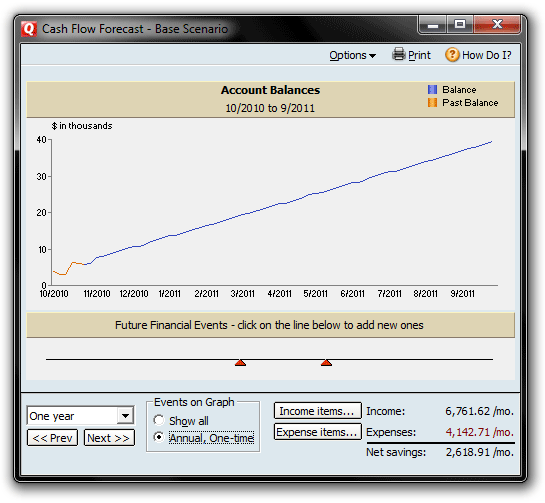
    When I select that, Quicken displays a graph like this:

    That awfully smooth, upward-sloping line is meant to show me how my bank-account balances will steadily increase over the next year IF my monthly “Income Items” and “Expense Items” meet the parameters I’ve set up. (Displayed figures above have been certified by the Congressional Budget Office. So you know they’re, uh, reliable.)

    Forecasting: It’s a Lot of Work

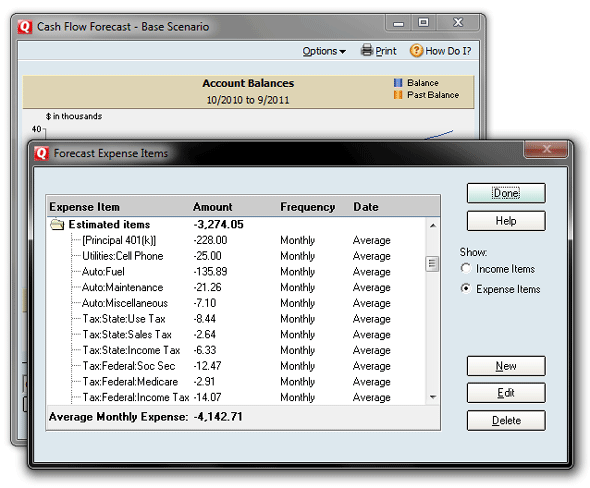
    The graph is all fine and dandy, I suppose. However, it took me a patience-testing hour or so to get Quicken’s Cash Flow Forecast set up in a way that’d reflect anything close to reality. Initially, Quicken’s “brain” had taken my next year’s worth of Scheduled Transactions, combined it with my average monthly categorized income and expenses, and applied all of that to my household financial cash flow in a manner that I can only describe as MADDENINGLY RANDOM.

    Some “income items” appeared twice. Many “expense items” appeared three and four times. Now, I’m all for conservative planning, but come on. Those initial figures were a disaster, and way out of whack.

    I can’t imagine that any large chunk of Quicken users would be willing to plow through their incomes and expenses, category by category, Scheduled Transaction by Scheduled Transaction, just to get this thing running at a somewhat realistic clip. I did it, but only because I’m a money dork. The rest of you probably have lives.

    Just Start Over?

    The Cash Flow Forecast allows you to create and save different scenarios, which is probably pretty useful IF you have a few hours to kill. I wasn’t even willing to approach this feature, given what it took just to get the thing set up. (When making changes, income and expense items aren’t even listed in alphabetical order, for crying out loud. Who the hell came up with this?)

    I think that, if I were going to rely on the Cash Flow Forecast at all, I would start by scrapping ALL of the estimated items Quicken creates. I’d then simply enter the categories I wanted, by hand, starting with my largest categories (taxes, food, insurance, etc.) first. I’d likely keep the “Known Items,” as Quicken creates these from Scheduled Transactions, which ought to be fairly ironclad. (Ironclad, that is, IF you’re good about setting up all your recurring transactions as “Scheduled Transactions.”)

    Like a lot of Quicken “tool” offerings, there’s probably some value in the Cash Flow Forecast … but if you’re like me, it might take you so long to rebuild the Forecast data that you simply ignore it altogether.

    Sorry, Intuit. I’m opting instead for dumping a few months’ of Quicken report data into Excel, and working from there!


  8. Debt-Free is Nice, But…

    A couple of weeks back, I spent some time thumping on How to Get What You Want in Life With the Money You Already Have, a book written by Carol Keeffe in the early 1990s. While not a literary prize by any stretch, the book deserves some credit: It did get me started in the world of personal-finance reading.

    One of Keeffe’s particularly egregious recommendations — and this is just kerfuffle waiting to happen — is for folks to make minimum payments on all their bills and credit cards until they’ve saved up six months’ worth of salary as an emergency fund. To me, such a plan would almost guarantee failure. How many folks do you know with the financial (and disciplinary) ability to pull that off?

    Not many, is my guess.

    I much prefer Dave Ramsey’s Baby Steps plan, and its suggestion to make “minimum payments only” until one saves $1,000 (or $500, if you’re a low-income household) … and THEN to attack the debts full-force and head-on.

    However, as I was finger-flipping through How to Get What You Want a little more, I managed to find a few paragraphs that stood out — in a good way! Actually, I found this to be quite insightful, and a bit Suze-Orman-esque:

    For most of us there are two things that would make a big difference in the quality of our lives: (1) having the deeply satisfying feeling of knowing we’re directing money toward making our dreams come true, and (2) having the secure feeling of knowing money is available for today’s emergencies as well as tomorrow’s needs.

    Well, I’m not so sure about the “making dreams come true” part, but I’ll vouch for the utter goodness of financial security. Having money available for emergencies changes everything. Life looks far different when you’re ready for the speedbumps and potholes.

    Keeffe continues:

    If you were thinking that eliminating a bill would make a significant difference in the quality of your life, watch out. It’s only a diversionary tactic of the mind. Of course things would be better if the bills were more under control or gone altogether. But eliminating a bill creates only a temporary feeling of relief compared with the deep and lasting feelings of power and security that money in hand creates. The availability of money means choices, and choices mean control. Lack of bills will never compare to the potency of having choices (money).

    You know what? I agree with this. One. Hundred. Percent.

    As a guy who’s made it through Step 3 of Ramsey’s Baby Steps (no debt except for the mortgage; fully-funded emergency fund is in place), I found that for me, while paying off that last debt felt great, hitting my savings mark felt even better.

    As Keeffe notes, “Eliminating a bill creates only a temporary feeling of relief, compared with the deep and lasting feelings of power and security that money in hand creates.” To this I say: AMEN.

    Debt-free is sweet, but there is no substitute for savings.

    But We Gotta Qualify This…

    As much as I love what Keeffe says here, she is still presenting it in the context of “You need to have a bunch of money saved BEFORE you begin seriously paying off your debts.” The logic of this baffles me entirely. While it sounds silly, I want to scream at her, “Hey! The longer your readers stay in debt, the less likely they’re ever going to get out of it!”

    Though of course I have no quantifiable evidence to support this, everything I’ve learned to date, and everything I’ve seen, points toward the assertion that the more you muddle through life, simply “living with” your bills and debts, the less likely you are to ever get out from under them. Let’s face it: Banks and other lending institutions endeavor to make it so.

    At some point the lack of progress, the years of frustration and stress — all of it accumulates into the deadly “This is just how everyone lives!” attitude.

    At which point, you’re sunk.


  9. $100k Workers: Paycheck to Paycheck

    Well, for a minute there, I was almost felt a tinge of sympathy.

    Almost.

    CNBC: More Upper Incomers Living Paycheck to Paycheck

    The centerpiece finding of the above article, I’d say, is this juicy tidbit:

    Thirty percent of workers with salaries of $100,000 or more said they are living paycheck to paycheck, up from 21 percent last year, according to the survey of 4,400 workers nationwide.

    Overall, 61 percent said they always or usually live paycheck to paycheck, up from 49 percent in 2008 and 43 percent in 2007.

    I mean, those $100k salaries don’t go as far as they used to. Thankfully, we can be sure that the reason these folks are feeling stretched money-thin is that they’re cramming as much cash as they can into retirement savings, which can leave them FEELING as if they’re living paycheck-to-paycheck.

    Thirty-six percent said they don’t contribute anything to retirement savings, like a 401(k) or a IRA.

    As for short-term savings, 33 percent of those surveyed reported that they don’t put any money aside each month, up from 25 percent in 2008.

    Okay. Forget I said that.

    We’re screwed.


  10. More Savings Data

    In a bit of survey data that goes hand-in-hand with my “Who Is Saving?” post from a few weeks ago, the Employee Benefit Research Institute earlier this year released its 2010 version of the Retirement Confidence Survey:

    EBRI: 2010 Retirement Confidence Survey

    Among its more-distressing findings:

    • 27% of workers report having $1,000 or less in savings
    • 54% of workers report a total household value of savings and investments (excl. primary home and any defined-benefit plans) to be less than $25,000

    There’s a nice summary of the survey findings in the March 2010 EBRI Issue Brief (pdf).